All too often, tuning “experts” make modifications before they know what needs to be modified. If you don’t do your research or know what you’re doing, you can certainly set yourself up for failure from the start. In this article, we will look at the terminology associated with tuning and give you a solid baseline on what to data log.
Let’s say Johnny gets his tuning software up and running — the first thing he wants to do is start changing a tune file. Johnny makes some changes, downloads the new file into an ECM, and goes out for a test ride. His biggest mistake, aside from thinking he was a tuning whiz, is not finding out the specifics of what needed to be changed before he started modifying the tune file.
Assuming Johnny’s vehicle will start and run, the first step is to create a data log. If it doesn’t start, he will need to identify the most likely causes. For example, if a cam swap has been performed, it will probably be necessary to increase idle speed and corresponding airflow settings. If the injectors have been changed, verify the flow rate and make sure the values in the fuel flow table are reasonably accurate.
Keep in mind that it is possible to “tune around” a mechanical problem, but ultimately, the true problem will have to be corrected, and when it is, the system will have to be readjusted. It isn’t unusual for an undiagnosed mechanical problem to cause a tuner to chase their tail trying to “correct” what is assumed to be incorrect data in a tune file. If logged data looks reasonable, but the engine still pops, bangs, and spits, look for mechanical problems like a vacuum leak, spark plug or plug wire damage, and sensor damage.
What to Log
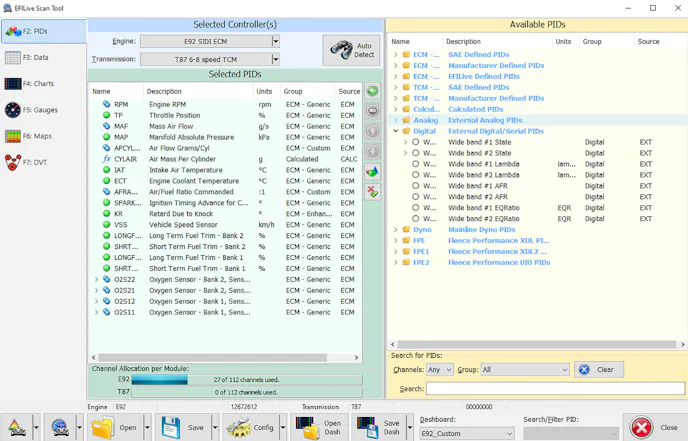
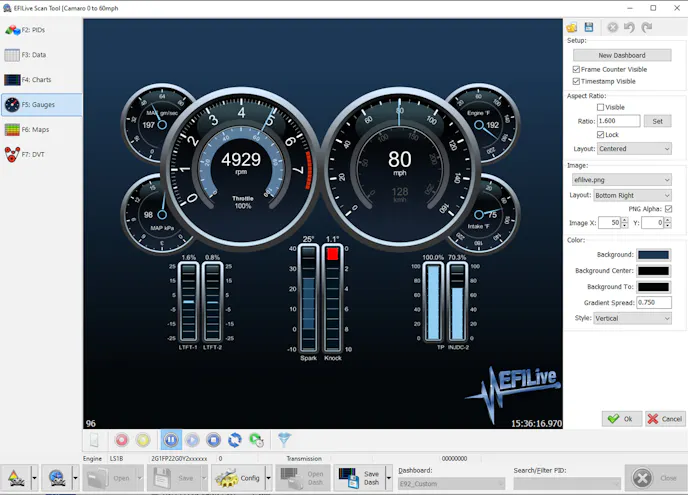
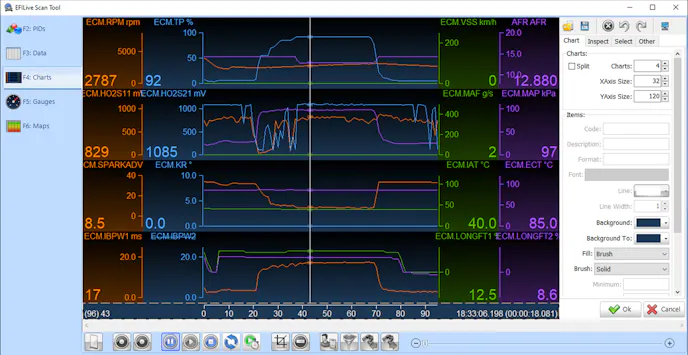
One of the many advantages offered by EFILive’s FlashScan software is the capacity to create and modify dashboards easily. With the number of parameter identifiers (PIDs) available, it’s impossible to make a one-size-fits-all virtual dashboard that contains the gauges needed for every troubleshooting scenario. However, a base layout, such as the one shown below, applies to most tuning challenges. Except for some genuinely unique troubleshooting issues, the basic gauges (identified by their respective labels) and their relevance are:
TPS– Throttle Position Sensor values indicate static position as well as transitions. While actual throttle position may not relate to some issues, the relationship of throttle position to manifold pressure and airflow can often point to a source of a problem. It’s also advisable to make sure the throttle moves to the wide-open position when the gas pedal is pushed to the floor and returns to the closed position when the pedal is released.
MAF– Mass Air Flow sensor readings indicate the amount of air flowing into an engine, which shows its operating efficiency.
IBPW1 – Injector Base Pulse Width (Bank 1) in milliseconds. There are exceptions, but it’s generally not necessary to log pulse width for both Bank 1 and Bank 2. One obvious exception being when Bank 2 oxygen sensor voltages are significantly different than those of Bank 1
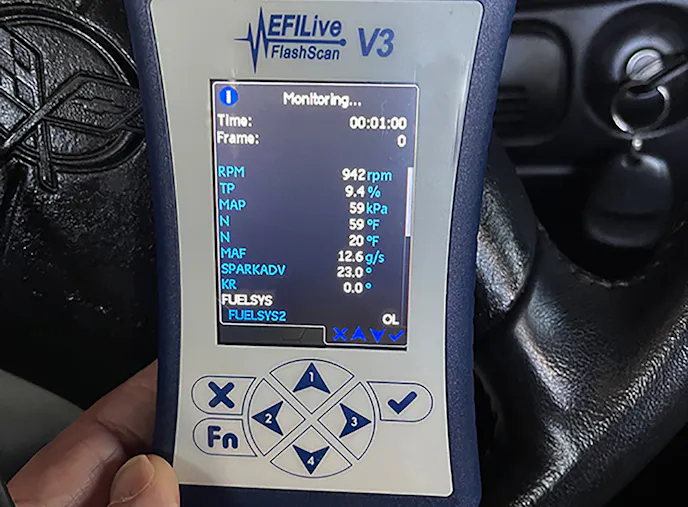
Spark – Total ignition advance in degrees.
KR Deg– Knock Retard in degrees.
STFT1% – short-term fuel trim. This is the amount of fuel that the system adds or subtracts during closed-loop operation. Short-term fuel trim changes quickly in response to changing operating conditions. It is not an accurate reflection of overall air/fuel ratio accuracy. (See Long Term Fuel Trim)
AFR – This is commanded as opposed to the actual air-fuel ratio. It’s a good idea to connect a wideband O2 sensor system to the FlashScan unit so commanded, and actual AFRs can be easily compared. (See WO2AFR1 below)
RPM – If you don’t understand the reason for this gauge, you’re on the wrong website.
Cyl Air – As opposed to MAF readings, which indicate total airflow, Grams/Cylinder indicates engine load.
WO2AFR1 – If you have a wideband O2 sensor installed, it’s incredibly beneficial to have its readings appear on the FlashScan dashboard as opposed to logging readings externally.
MAP – Manifold absolute pressure indicates engine load based on the pressure within the intake manifold. (MAP sensor readings) (Cyl Air shows load based on airflow and RPM.)
ECT – Engine coolant temperature readings indicate the obvious and relate to a number of tables that affect fuel and spark settings.
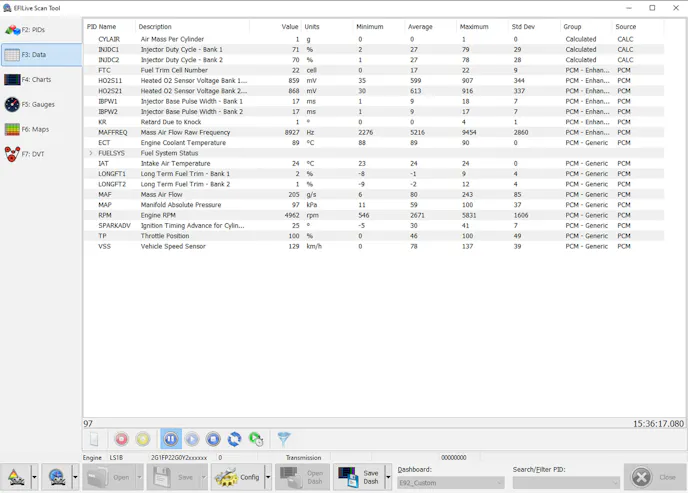
Bank-1 and Bank-2 – These indicators are green if the system is operating in Closed Loop, Red if it’s in Open Loop.
HO2S11 – Heated Oxygen Sensor Bank 1, Sensor 1. During closed-loop readings, typically toggle between 0 and 1,000 millivolts
HO2S12 – Heated Oxygen Sensor Bank-1, Sensor 2 The secondary oxygen sensor’s function is to monitor catalytic converter efficiency. It may or may not toggle similar to the front sensor depending on operating conditions.
LTFT1 Long Term Fuel Trim Bank-1. Trim percentage indicates the amount of fuel adjustment made by the system to maintain stoichiometric air/fuel ratio.
IAT – As with coolant temp, Inlet Air Temperature indicates the temperature of the air flowing into the throttle body. These readings relate to a number of tables that affect spark and fuel settings.
HO2S21, HO2S22, and LTFT2 – These sensors monitor Bank-2 conditions and operate the same as their Bank 1 companion gauges.
Once an appropriate data log has been created, take a few minutes to look over the graph on Dashboard page B. The variables on the chart don’t have to be the same as those on the A Page. Before looking at individual readings in detail, look over the entire graph and look for any readings that appear to be excessively out of range. GM sensors and controllers are incredibly reliable, but they can fail or operate incorrectly due to wiring or connection problems. More than one tuner has spent a lot of time chasing a “tuning problem” to find out that sensor input or controller output was faulty.
After you’re satisfied that the data in the log is accurate, the first thing to check is primary oxygen sensor performance. After the system has gone into “Closed Loop” mode, the voltage levels for both primary oxygen sensors (HO2S11 and HO2S21 — Heated O2 Sensor Bank 1, Sensor 1 and Bank 2 Sensor 1) should toggle continuously between zero and 1,000 millivolts. The readings may not drop to zero or hit 1,000 but should toggle from less than 100 millivolts to more than 800 millivolts. Bank-1 and Bank-2 readings won’t necessarily be identical but should toggle at a similar rate and within the same range.
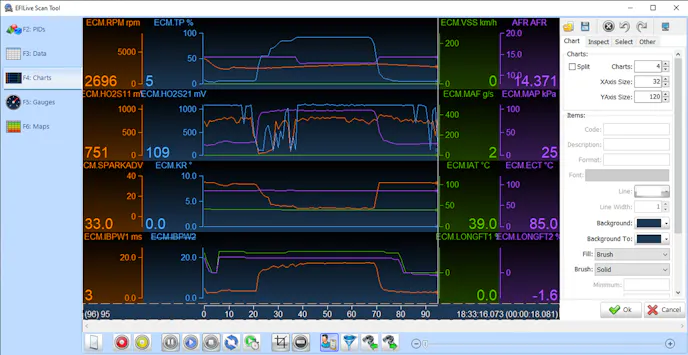
Narrowband O2 sensor readings are often misinterpreted because sensor function is misunderstood. Although readings below +/-450 millivolts indicate a relatively lean air/fuel ratio, and readings above +/- 450 indicate a moderately rich condition. Specific millivolt readings don’t correspond to a particular air/fuel ratio. Narrowband O2 sensors are designed to tell whether the air/fuel ratio is lean or rich. Sensor voltages toggle during closed-loop operation because the system responds to a lean indication by richening the mixture and a rich implication by leaning the mixture. The desired goal is to achieve a stoichiometrically correct ratio (such as 14.7:1 for gasoline containing no alcohol) by constantly varying fuel flow.
If the primary O2 sensors are operating correctly, Long Term Fuel Trim (LTFT) percentage is a reliable indication of fuel calibration accuracy, or the lack thereof. The target is for LTFT to be between zero and –5-percent. If trims are positive, air/fuel mixtures can be excessively rich when the throttle is depressed sufficiently to cause the system to transition to an open loop.
During closed-loop operation, the system references a number of cells for LTFT data. The information in each cell pertains to a specific RPM/engine load range. The trim percentage at idle may be considerably different from the percentage associated with highway cruise or light acceleration. The data in these cells serve as a starting point for fuel trim when the system transitions into closed-loop operation. It isn’t unusual for these starting points to vary considerably across the RPM/load spectrum, so having different starting points shortens the ECM’s learning process. The data in these cells is reset to zero when power is removed from the PCM.

When logging data for the first time after extensive engine modifications or with a problem vehicle, it’s usually more convenient to create several relatively short data files rather than one long one. To properly tune a car, data for the entire range of commonly encountered operating conditions must be logged. If all data is contained in a single file, navigating through it can be cumbersome. With several shorter files, each one can be identified as to the operating condition to which the data applies. As an example, one file might be confined to idle conditions, another to light acceleration and cruise, and a third to wide-open throttle operation.
After the first series of adjustments are made to a tune file, you may not need extended logging sessions to acquire the necessary data for fine-tuning. At that point, a single file containing data for a variety of operating conditions may be appropriate because it will be of reasonable length.
While the above information will get you headed in the right direction, there is a lot more to know when tuning a vehicle. We will take a deeper dive into this subject in our next installment, so stay tuned.
You might also like
Project Swedish Meatball Gets Melling Upgrades
To ensure reliable horsepower, Project Swedish Meatball gets equipped with a durable new water pump and a timing set from Melling Performance.